The phase analysis tool is used for analyzing the characteristics of phase modulated signals, and to a limited extent, m-ary PAM (Phase Amplitude Modulation) signals.
If the symbol rate is known (for details see PSK Symbol Rate (HF, DIR, SUB and SAT)), start the PSK phase plane analysis tool.
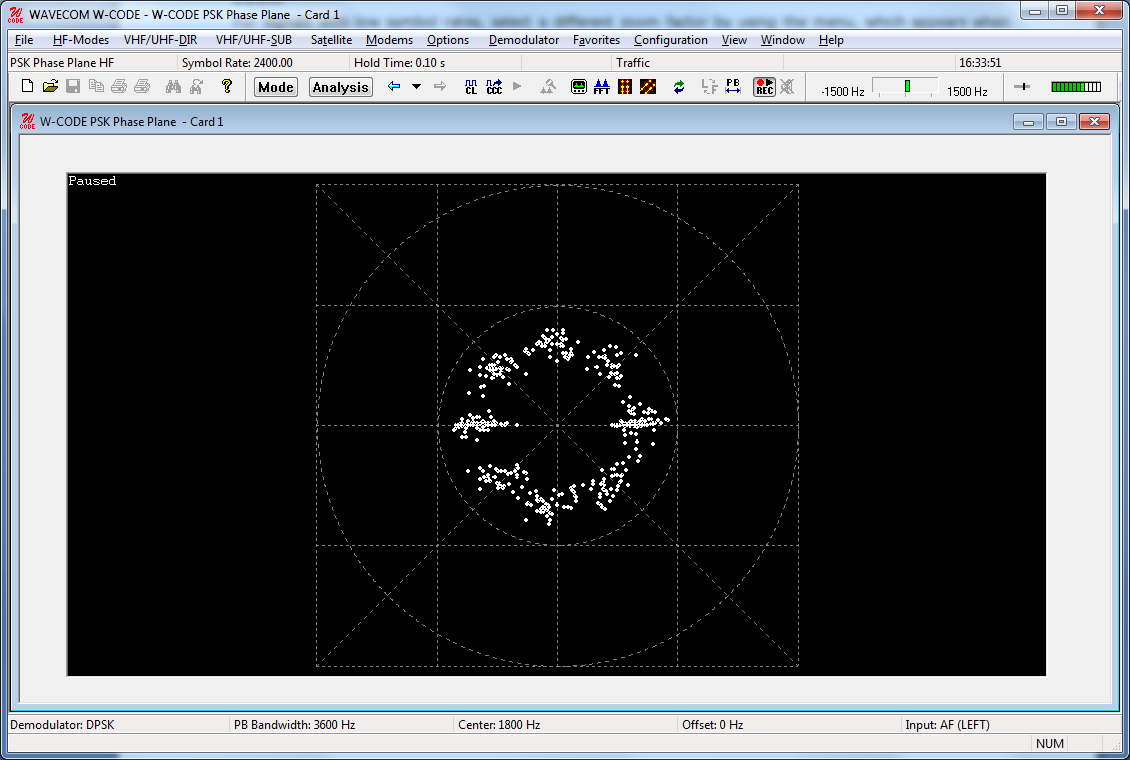
The display can be started and stopped by clicking on it. If stopped, a Paused message is displayed.
You can use an existing demodulator (BPSK, QPSK or DPSK) or IQ to decode the signal, and produce a phase plane display of the output of the demodulator. For BPSK and QPSK, this provides a check of the quality of the signal. When using DPSK, this provides an indication of the level of phase modulation which is being used, i.e., 2-PSK to 16-PSK. As the symbol rate is equal to the baud rate of the signal, the baud rate must be known to configure the demodulator.
Center
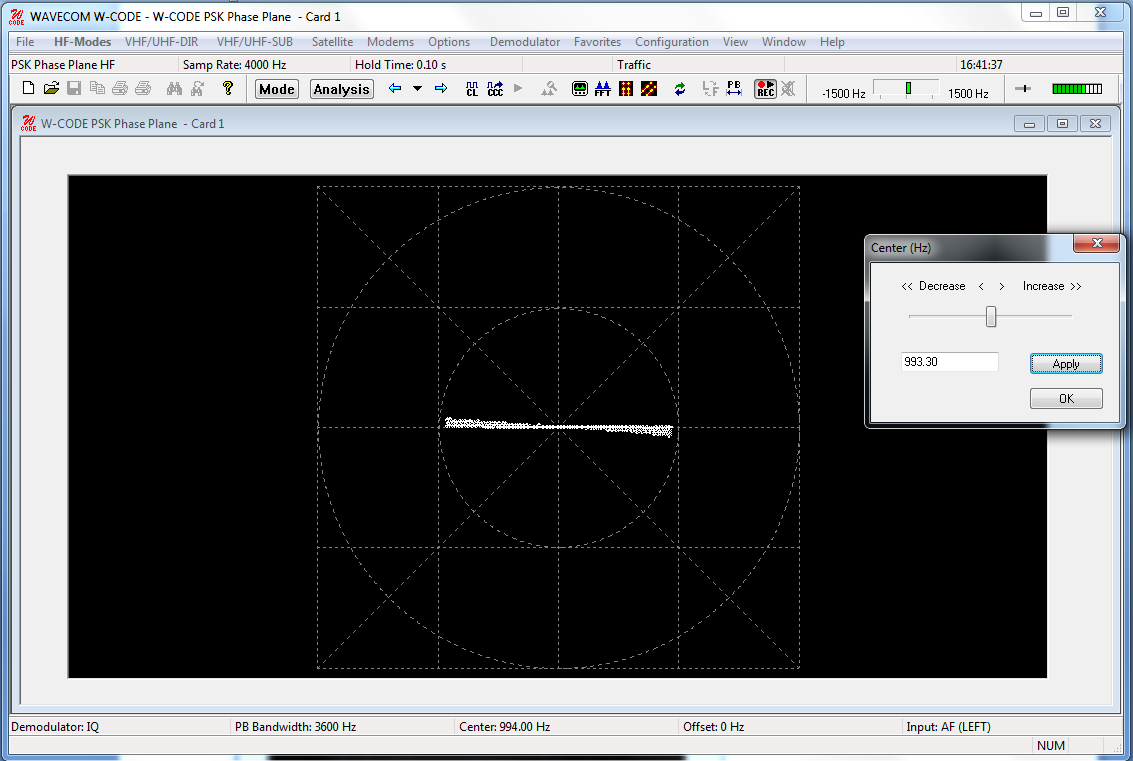
The Center allows the center frequency for the demodulator to be adjusted. A center frequency error normally results in a phase plane that is rotating with a speed proportional to the frequency error.
Hold Time
The Hold Time adjusts the number of points displayed on the screen. Increasing the hold time increases the amount of time a dot will remain in the image before being overwritten by a new value.
Demodulator Mode
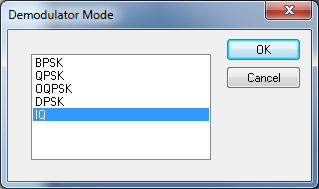
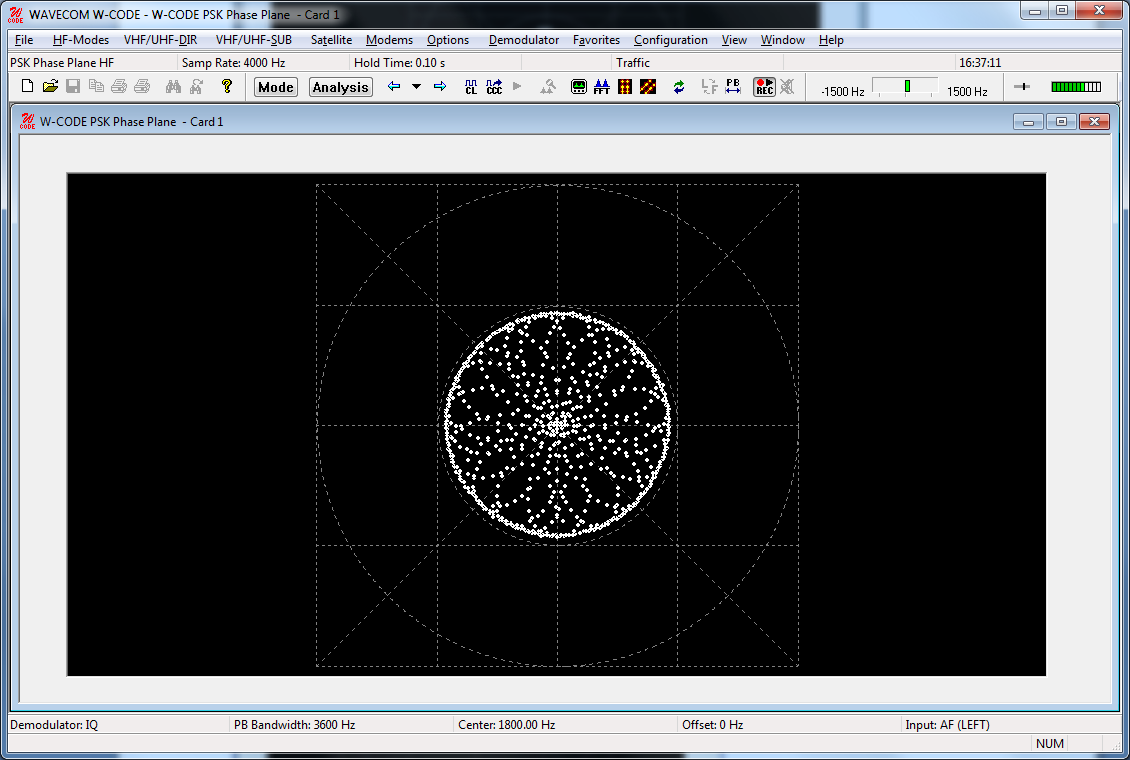
If you select IQ as the demodulator, the signal is not demodulated at all. Instead, the phase of the signal is visually 'compared' with a reference signal. Providing the correct reference signal is selected, this will result in a phase display that provides an indication of the type of PSK or PAM signal. The points will trace the path taken as the signal phase change. At the nominal signal mapping points, there is normally an accumulation of data points, providing a visual clue to the overall signal mapping.
Multi-channel DPSK signals often have a very narrow channel signal bandwidth. This results in the phase of the signal never remaining constant, and so the accumulation of signal points in the phase plane is not visible. To quantify such signals use the IQ demodulator mode.
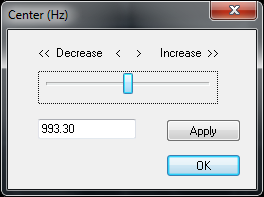
The frequency of the reference signal is set using the Center option. Note that if the reference frequency is incorrect, the display rotates at a rate that is the difference between the reference frequency and the true carrier frequency of the signal. When adjusting the reference signal, the changes are 'live'. This means that changes you make immediately take effect, and the resulting change in the phase display is immediately visible on the display.
|
Incorrect settings
|
Correct settings
|
Several Color schemes for both tools are available through the right-click menu.
In summary, the basic steps for analyzing a suspected (D)PSK signal are as follows:
Ø Use the FFT in the PSK Symbol Rate analysis tool to characterize the signal. Use the cursors to configure the estimate of the center frequency and bandwidth.
Ø Use the PSK Symbol Rate analysis tool to measure and select the symbol rate of the signal.
Ø Try and view the phase plane of the signal using the DPSK demodulator. If the signal is a PSK signal, the phase plane should be visible.
Ø If the DPSK demodulator failed to produce a meaningful display, try the IQ demodulator. This requires accurate adjustment of the reference signal to produce a meaningful display.
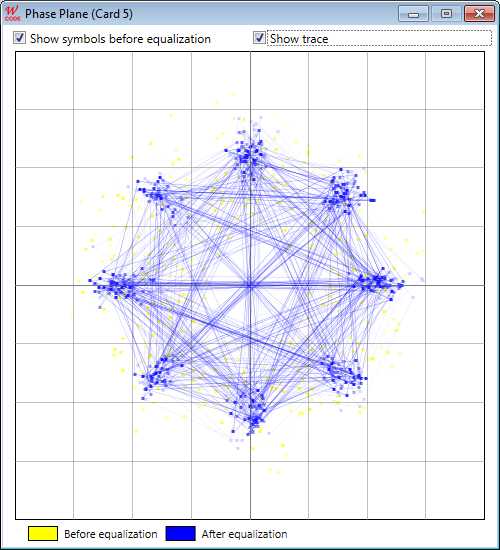
Dedicated Phase Plane for MIL/STANAG Modes
Most MIL and STANAG modes employ high-speed (e.g., 2400 Bd) PSK or QAM modulations. Phase Plane with traditional demodulators will deliver only unsatisfying visualization result. There is a dedicated “Phase Plane” in most MIL/STANAG modes to show the phase constellation before (in yellow) and after (in blue) the equalizer. The phase display in yellow would correspond to the display in the traditional phase plane. User can display this dedicated phase plane in Options -> Show Phase Plane.