Classifier User Interface
The classifier user interface consists of a settings screen
and two :
Ø An window
Ø A list of classified signals
|

|
Press the Classifier button to launch the
classifier or select it in one of the analysis menus or
selectors. |
|

|
Press the Start/Stop Classifier button to
restart the classification. |
|

|
When the Classifier is launched a label positioned in
the left-hand side of the upper status line indicates the selected
frequency range and the acquisition mode. |
FFT Window
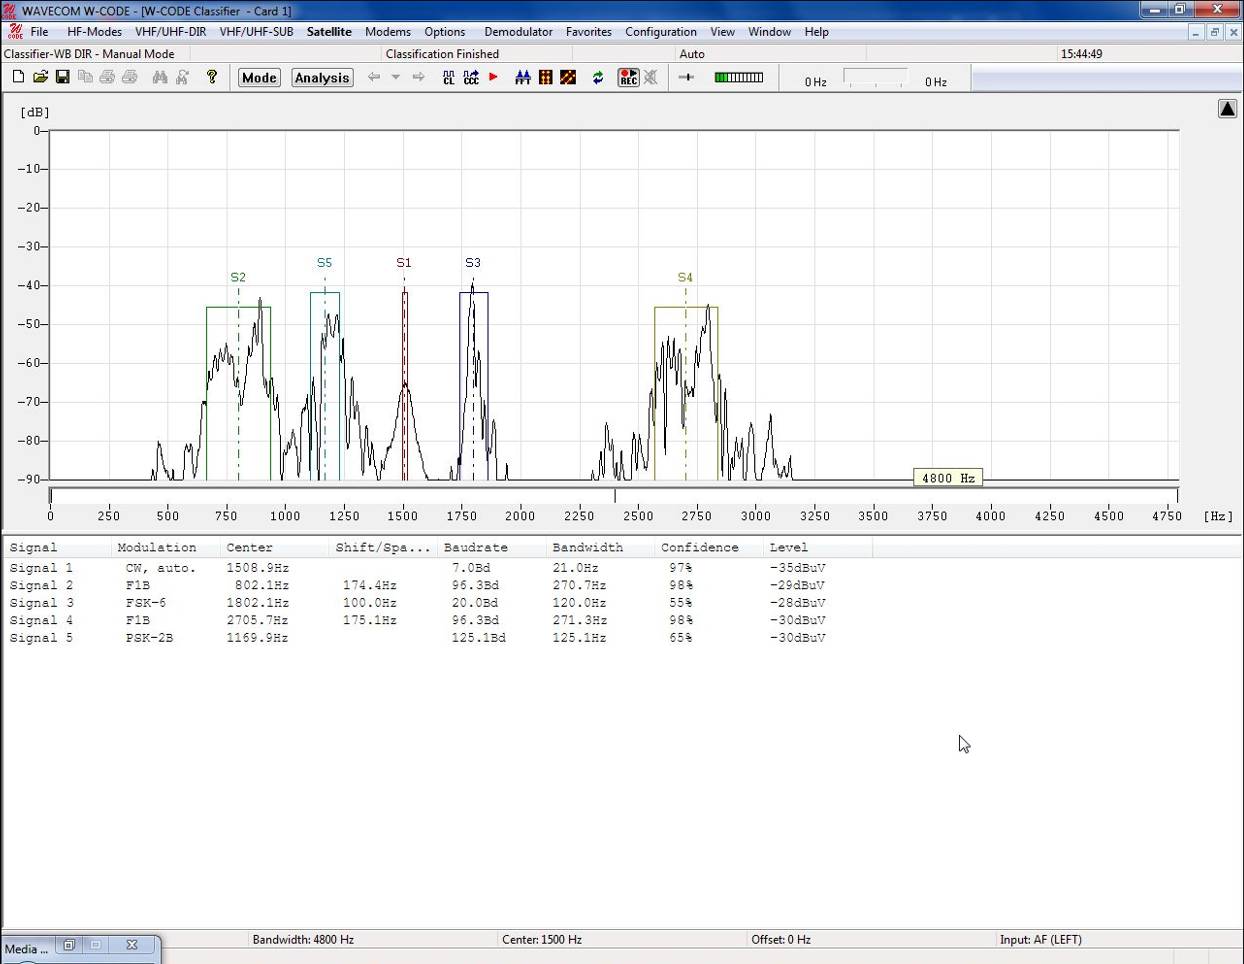
The upper FFT window is shown with five signals classified
in manual mode.
Classifier Settings
Settings are accessed through the Options | Classifier
Settings menu.
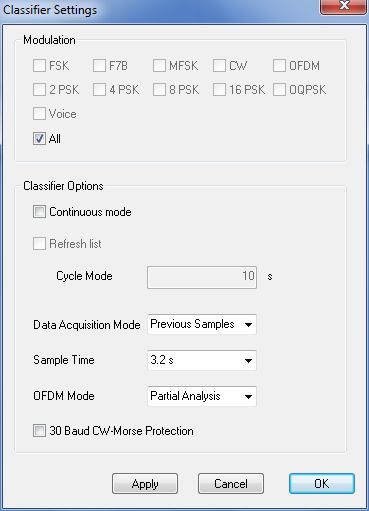
|
Modulation |
Check any number of modulation types or voice using
the appropriate check boxes to narrow down the range of recognized
signals. |
|
Continuous Mode |
If continuous classification is desired check this
box. Continuous mode can be halted and restarted pressing the
Start/Stop Classifier button.
If the Continuous Mode check box is left unchecked,
each classification must be started manually by pressing the Start/Stop
Classifier button. The classifier allows only one classification
attempt at a time. During classification attempts the Start/Stop
Classifier button is grayed out. |
|
Refresh List
|
If the Refresh List check box is checked, the list of
results will be cleared after each classification attempt. This feature is
only available when continuous mode is selected. |
|
Cycle Mode |
This parameter sets the interval between
classification attempts if no signals were classified. Enter a restart
cycle length ranging from 4 s to 3600 s. Samples are available from two
sources:
Samples taken before the classifier was started
(select Previous Samples).
Samples taken after the classifier was started
(select New Samples). |
|
Sample Time
|
Choose a sample time of 1.6 or 3.2 s. The
probability of correct classification of low symbol rate signals increases
when the higher sample time is selected. |
|
OFDM Mode
|
If Full Analysis is selected the modulation
format of the OFDM subcarriers is also analyzed. If Partial
Analysis is selected, the modulation format of the subcarriers is not
analyzed. |
|
30 Bd CW-Morse Protection |
Checking this box will introduce a feature to prevent
the classifier from confusing CW and FSK signals at the edges of the
sampled input bandwidth. |
Use Demodulator | Center… or double-click in the
Center in the lower status bar for selecting an appropriate center
frequency.
To select the classification bandwidth, double-click in the
Bandwidth field in the lower status bar or open a menu list by in the FFT window. The Average Factor,
Window Type, Period and Peak Hold options in the menu list are
identical to the same real-time FFT options.
Classification Results List
The list is ordered in self-explanatory columns.
Each signal in the list is labeled and numbered as Signal
n, and in manual mode this corresponds to the Sn signal marker in the FFT window
– the marker is a box surrounding the signal envelope.
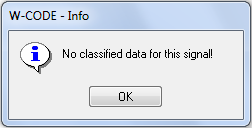
Certain signals listed below can be further studied in an
additional graphical view by double-clicking on the desired signal in the
results list. This function is not available in continuous mode.
If no panes are available this message is displayed:
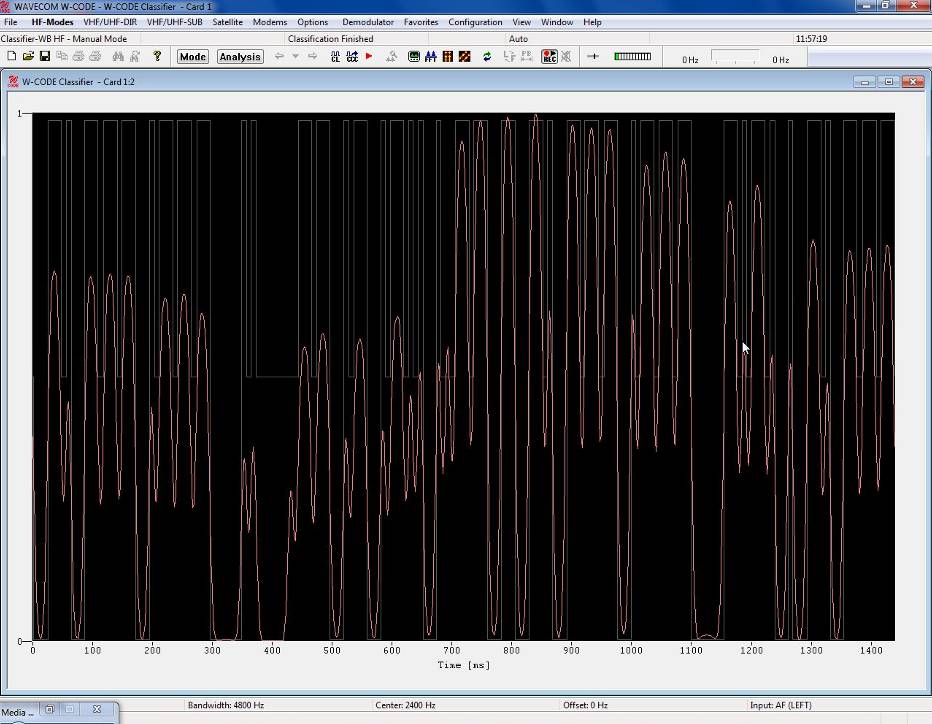
Three panes are available:
|
CW
|
Amplitude transitions are displayed along a time
axis.
|
|
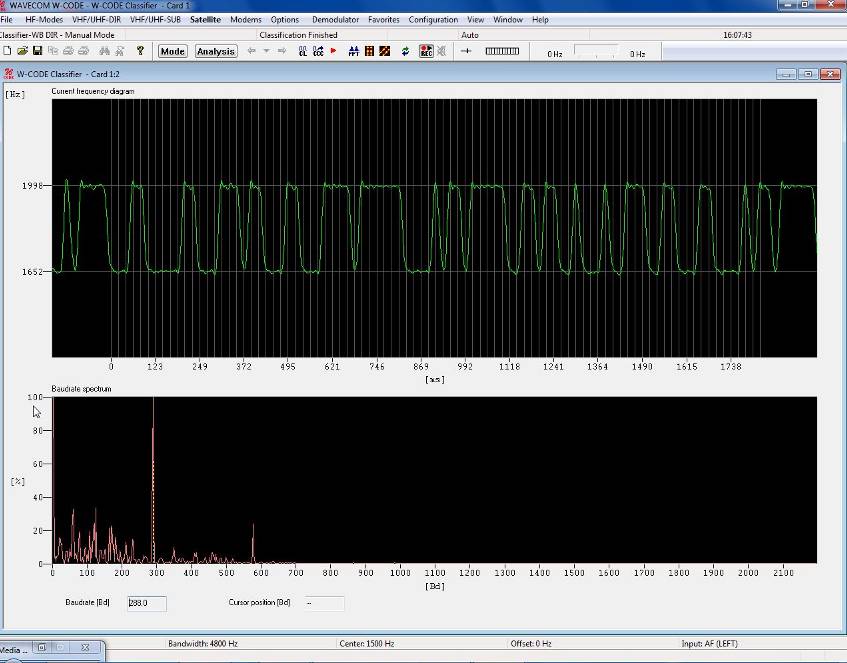
FSK
|
Frequency transitions are displayed along a time
axis. The values of two frequencies of the FSK signal are displayed on the
vertical axis.
|
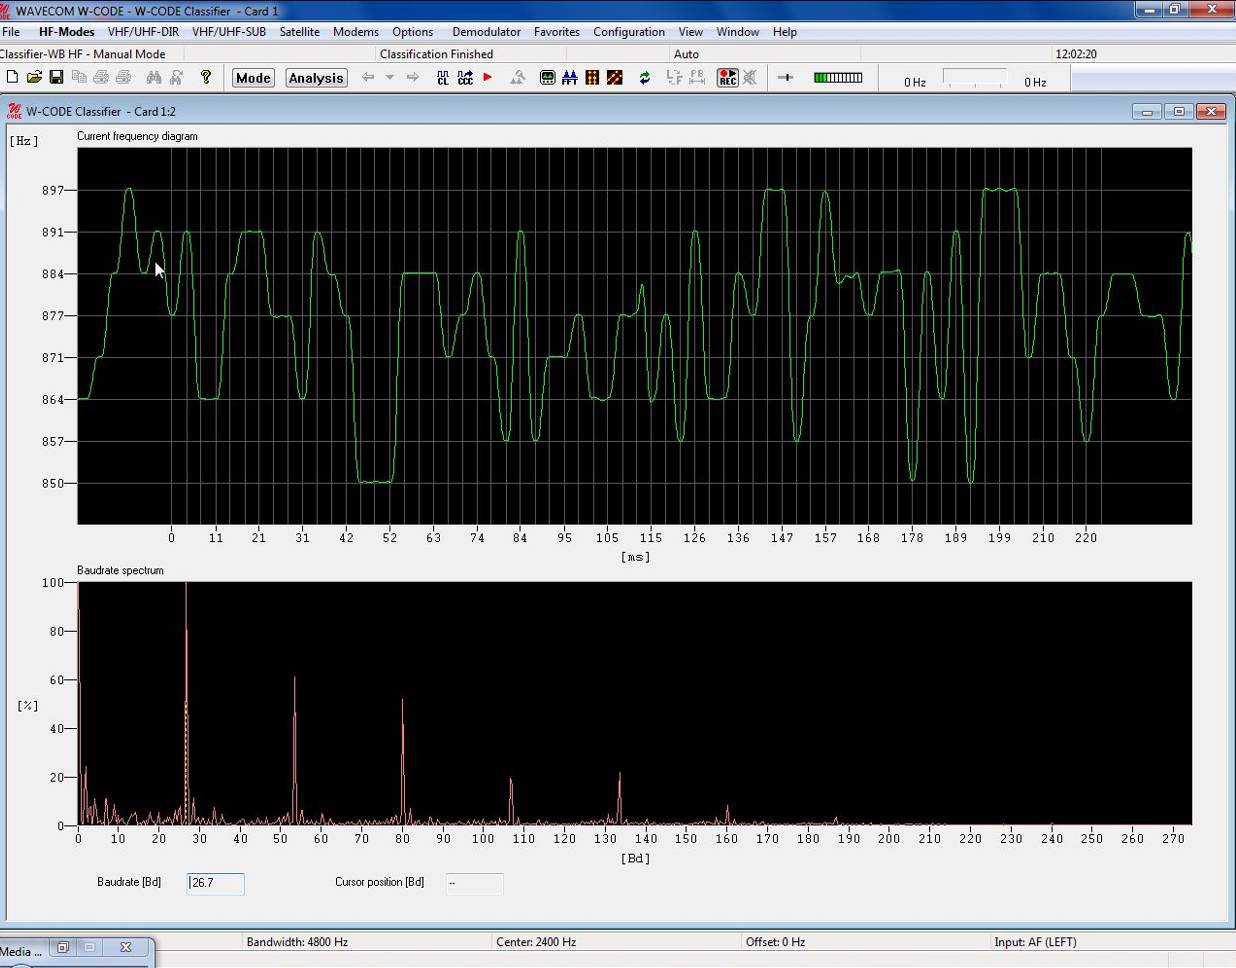
| |
Frequency transitions are displayed along a time
axis. The values of the frequencies of the MFSK signal are displayed on
the vertical axis.
|
|
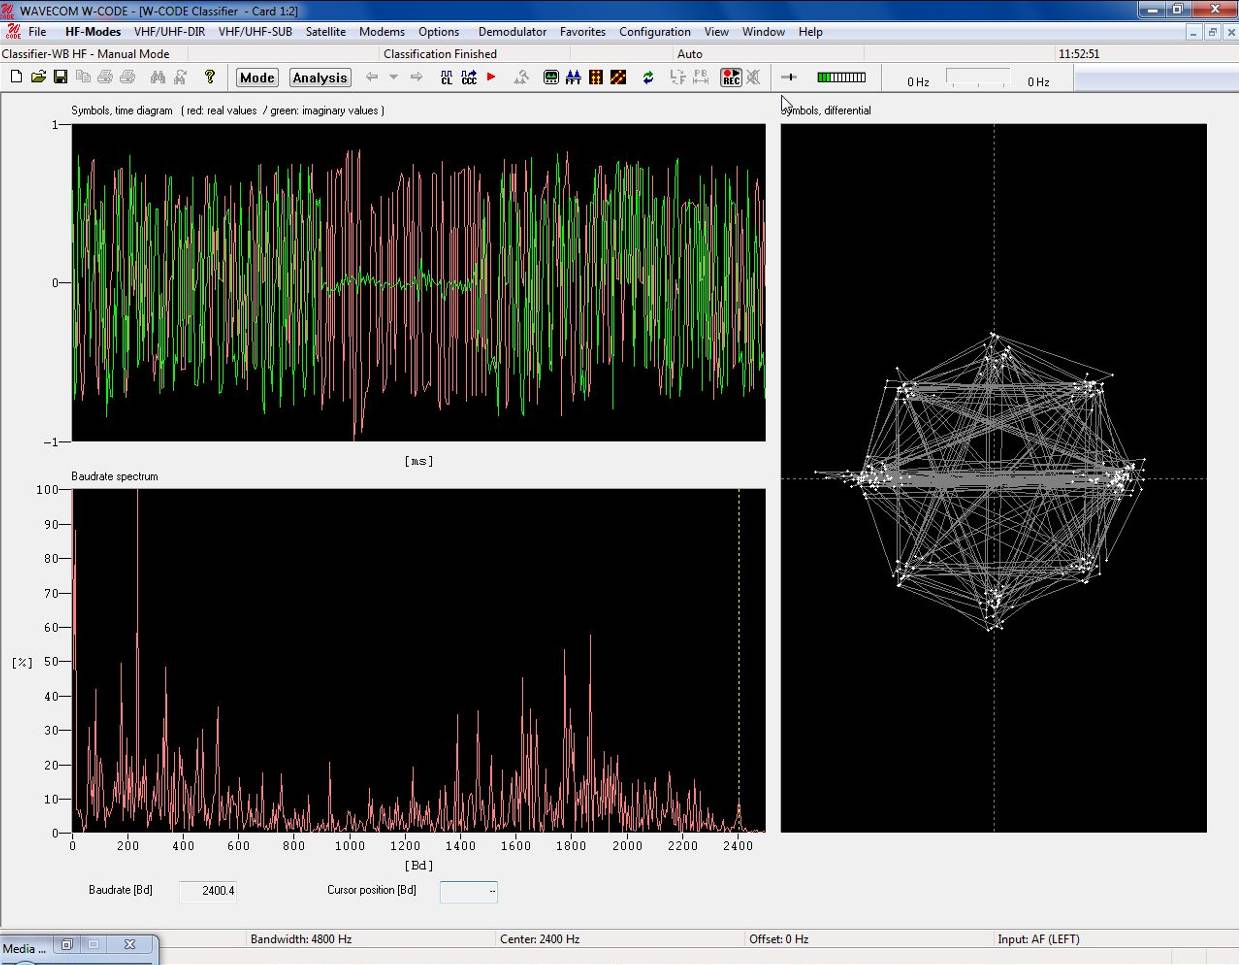
PSK
|
Phase transitions are displayed along a time axis –
the red graph shows the value of the real component of the signal (the I
component) and the green graph shows the value of the imaginary component
of the signal (the Q component).
|
Baudrate Spectrum
This pane displays a probability spectrum of the
instantaneous baud rates contained in the analyzed signal. The value of the
highest probable rate is marked by a vertical, dotted marker and numerically
displayed in a Baudrate box below the pane.
Moving the mouse cursor across this pane changes the cursor
into a crosshair, which can be used to determine the for
individual spectral components. The baud rate value pointed to by the crosshair
is displayed in a Cursor position box below the pane.
Differential Symbols
Phase plane display showing the differential phase
constellation of the signal. This pane is only available for PSK
signals.